We use Ekahau Pro™ software together with the Ekahau Sidekick®, for our survey and design work. Ekahau is an industry-recognised tool, with comprehensive facilities for testing and planning Wi-Fi networks. It can be used to measure network APs and rogues sources, and help report aspects of network health on heat maps (Signal-to-Noise Ratio - SNR, Signal, Noise, Interference, Throughput and log Roaming of the survey test device).
We are of course Ekahau ECSE certified, but much of what we do goes well beyond the ECSE certification.
For example, we complement the survey reports to demonstrate the actual performance profile of the Wi-Fi network, which is not immediately obvious from the basic heat map reports.
We explain this with an example.
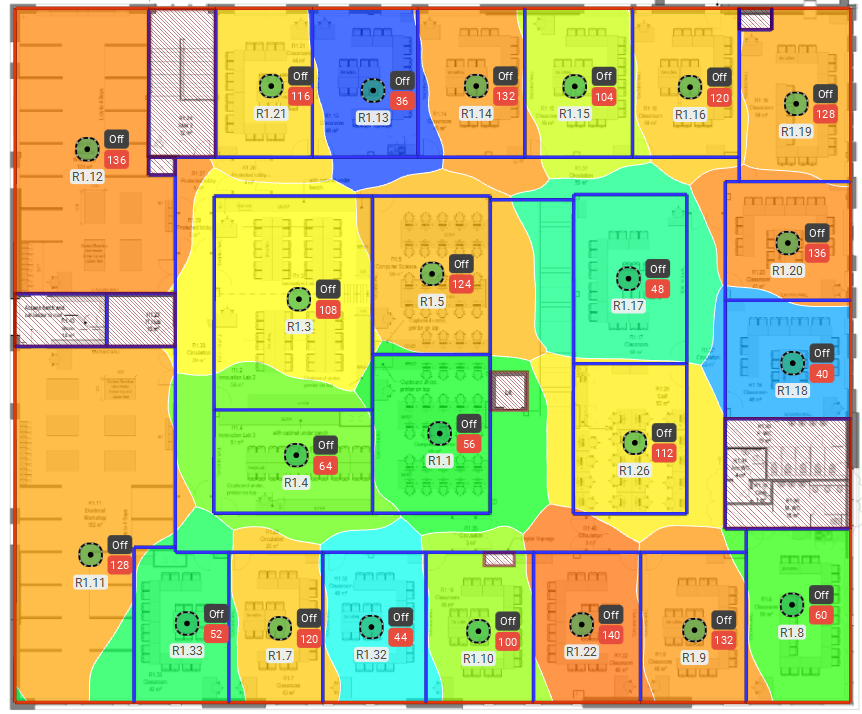
The heat map above shows Ekahau's estimate of individual Wi-Fi cells based on results from an actual APoaS survey. In this visualisation, each cell is represented by a different colour. However, it is the client devices, not the survey software that determines the actual cell shape, so it is important to be aware that actual cell shapes and sizes will differ from the Ekahau Pro™ estimates, although this is a useful guide when planning cell sizes. In this case, the main requirment was to provide certain capacities to various rooms, so it provides a simple example.
It is also important to point out that there was no requirement in this example for roaming in the corridors, otherwise the design would have been different. If this was a requirement, some APs would need to be placed in the corridors so that APs did not have to keep roaming from room AP to room AP as someone walked down a corridor, and if an AP could provide sufficient bleed into a room then that would be used instead of all of the APs being placed into rooms.
It is in monitoring throughput and roaming, that we complement the standard Ekahau outputs to demonstrate underlying performance
Coverage alone wont prevent drop outs In Wi-Fi good performance is achieved when there is a good Signal to Noise Ratio (SNR). A survey of this particular network shows an excellent SNR of over 40dB for most of the area, as shown in green on the following heat map. This would pass the performance criteria for most networks, and many networks are signed off on the basis of SNR and signal strength heat maps alone!
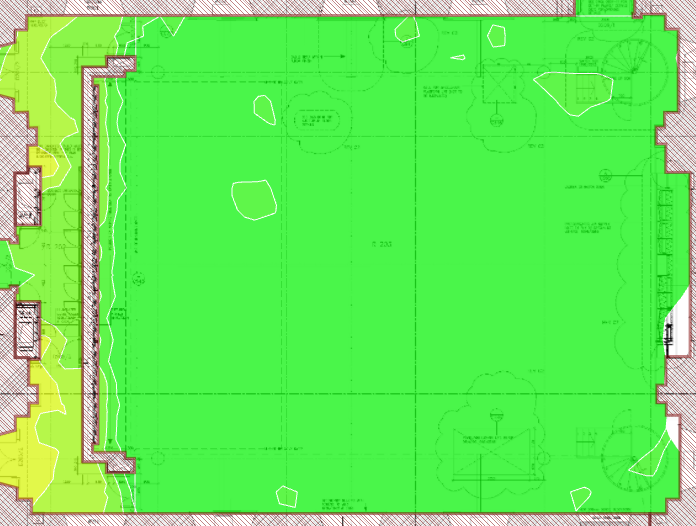
But if we undertake roaming tests, we see a different picture.
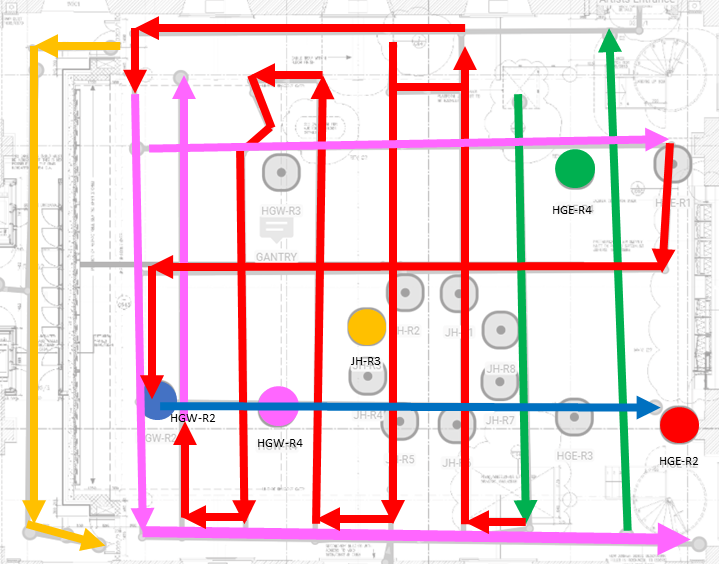
The AP radios/antennas are represented as circles, and are colour-coded in our diagram. The coloured lines represent movement of the client device, and show which AP the client device was associated with. In this example, we see that the client device ends up associating with the red AP most of the time even when it is on the other side of the room, This is because of differing AP models, software versions, Wi-Fi functionality and configuration as well as client device capabilities and requirements. This is not good for this site, because it is a capacity venue, hence the large number of AP radios/antennas, and they are supposed to share the load.
We also noticed some channel conflict in the AP configuration, so when we combine the throughput results, with the observed roaming results, we see areas where throughput drops off badly creating black spots. This is because of the roaming behaviour enforced by the Wi-Fi configuration that is causing some range issues as well as channel conflict issues which are also caused by the Wi-Fi configuration. Fortunately, as we now have this information, we can now fix the problems with specific configuration designed to change the observed behaviour.
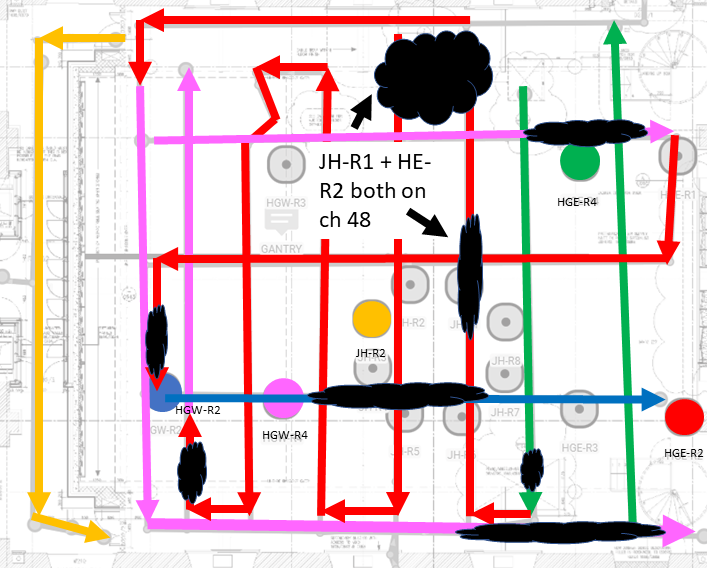
None of these issues can be seen from the basic heat maps that are commonly used to sign-off Wi-Fi networks!
This is why it is important to use the tools deeply to understand the actual performance profile of a Wi-Fi network, so that it can be designed and configured to work properly.
[For those that are interested, the behaviour is explained as follows:
The central ring of radios/antennas are individual semi-directional antenna elements within a very high-capacity AP which combine to deliver an overall omni-directional pattern. The AP is an older model, so it only supports 802.11n (Wi-Fi 4). The radios are also configured on high power.
The outer radios are attached to a newer 802.11ac (Wi-Fi 5) AP, these are attached to 60° patch antennas that point almost straight down in each of the locations shown. Some of the radios are on the 2.4GHz band and some are on the 5GHz band. The APs that the client device associates with in the main auditorium, are all on the 5GHz band. (It only associates on the 2.4GHz band in a corridor adjacent to the main auditorium, because the 2.4GHz signal penetrates into the corridor better than the 5GHz signal). All of the 5GHz radios are configured as 20Mhz-wide channels, with the exception of the one shown in red which is configured as a 40MHz-wide channel.
Within the main auditorium, the client device attaches exclusively to the 5GHz radios, because 11ac can deliver better speeds.
The client device ignores some of the 11ac-capable radios because they are configured as 802.11n on the 2.4GHz band.
As we already have plenty of 11n-capable radios that cover this space, all of the 11ac-capable radios can be configured as 5GHz radios instead.
The patch antennas are mounted high in the open auditorium and so they have a wide spread. This spread is not even though and it gets patchy at the edges where the signal drops sharply.
Most of the performance drops are because the client device holds onto a channel, before the signal suddenly gets very patchy, causing problems and forcing a roam. A better antenna arrangement, to create more even coverage with smaller cells but with more gradual edges would support a better roaming experience, but this might require some experimentation first.
The reason why the client device holds onto the channel from the red AP for so long, is because it is solely configured as a 40MHz-wide channel and should, algorithmically at least, deliver better performance.
The remainder of the performance drops are caused, because the client device is still associated with a relatively distant AP on the same channel, when there is another nearby radio/antenna on high power.
The problems could therefore be solved with a better antenna arrangement, better calculated and more even power levels, a more even configuration of 5GHz radios and 40MHz-wide channels across the board (because there is no voice usage to rely on a narrower range of 'non-DFS' channels, before the regs. change).]
To find out more about how Wi-Fi networks should be deployed see our main technical-design-articles